Install the central server.
For teams who'd rather keep monitoring data on their own infrastructure. The free tier gives you 50 checks at no cost, forever.
Download
Grab the server installer from the Downloads page - MSI for Windows, deb/rpm/tar for Linux coming soon.
Install & start
Windows: run the MSI.
Linux: sudo apt install ./rednetmonitor-server*.deb then start the service.
Run the setup wizard
First launch opens a setup wizard: database, server URL, the initial SuperAdmin account.
Enter your license key
Settings → License Key. Or skip it to run the free 50-check tier.
Install a Remote agent.
A Remote is a tiny agent that runs your checks. Install one per machine you want to monitor.
- In the app, click Add Remote - copy the ID and key.
- Download the Windows Remote MSI.
- Run the installer.
- Run "Configure RedNetMonitor Remote" from the Start menu.
1. Open a terminal window on the machine you want to monitor.2. In the app, click Add Remote - copy the ID and key.
3. Download the Linux Remote deb or rpm package.
4. Install the package and run the configuration script:
sudo /opt/rednetmonitor-remote/rnm_configure_remote
Coming soon! The MacOS Remote is in private beta - contact support if you'd like to try it out.
5. Type 1 to add a new remote connection.
6. Give it a name, paste the key from step 1, and the server URL (for self-hosted on port 6777: http://localhost:6777 or your custom URL; for hosted: https://eg.rednetmonitor.com).
7. Type 4 to start the service if it's not already running.
8. Type 9 to close the configuration tool, then refresh the app dashboard. Your new Remote should appear within 60 seconds with some checks already configured, ready for you to adjust and add checks to it.
==================================
Server connections:
1. "rr.rednetmonitor.com" -> https://rr.rednetmonitor.com/
Service status: Stopped
Heartbeat interval: 1 min
1. Add new connection
2. Edit a connection
3. Remove a connection
4. Start service
5. Stop service
6. Restart service
7. Send heartbeat now
8. Set heartbeat interval
9. Quit
Select an option:
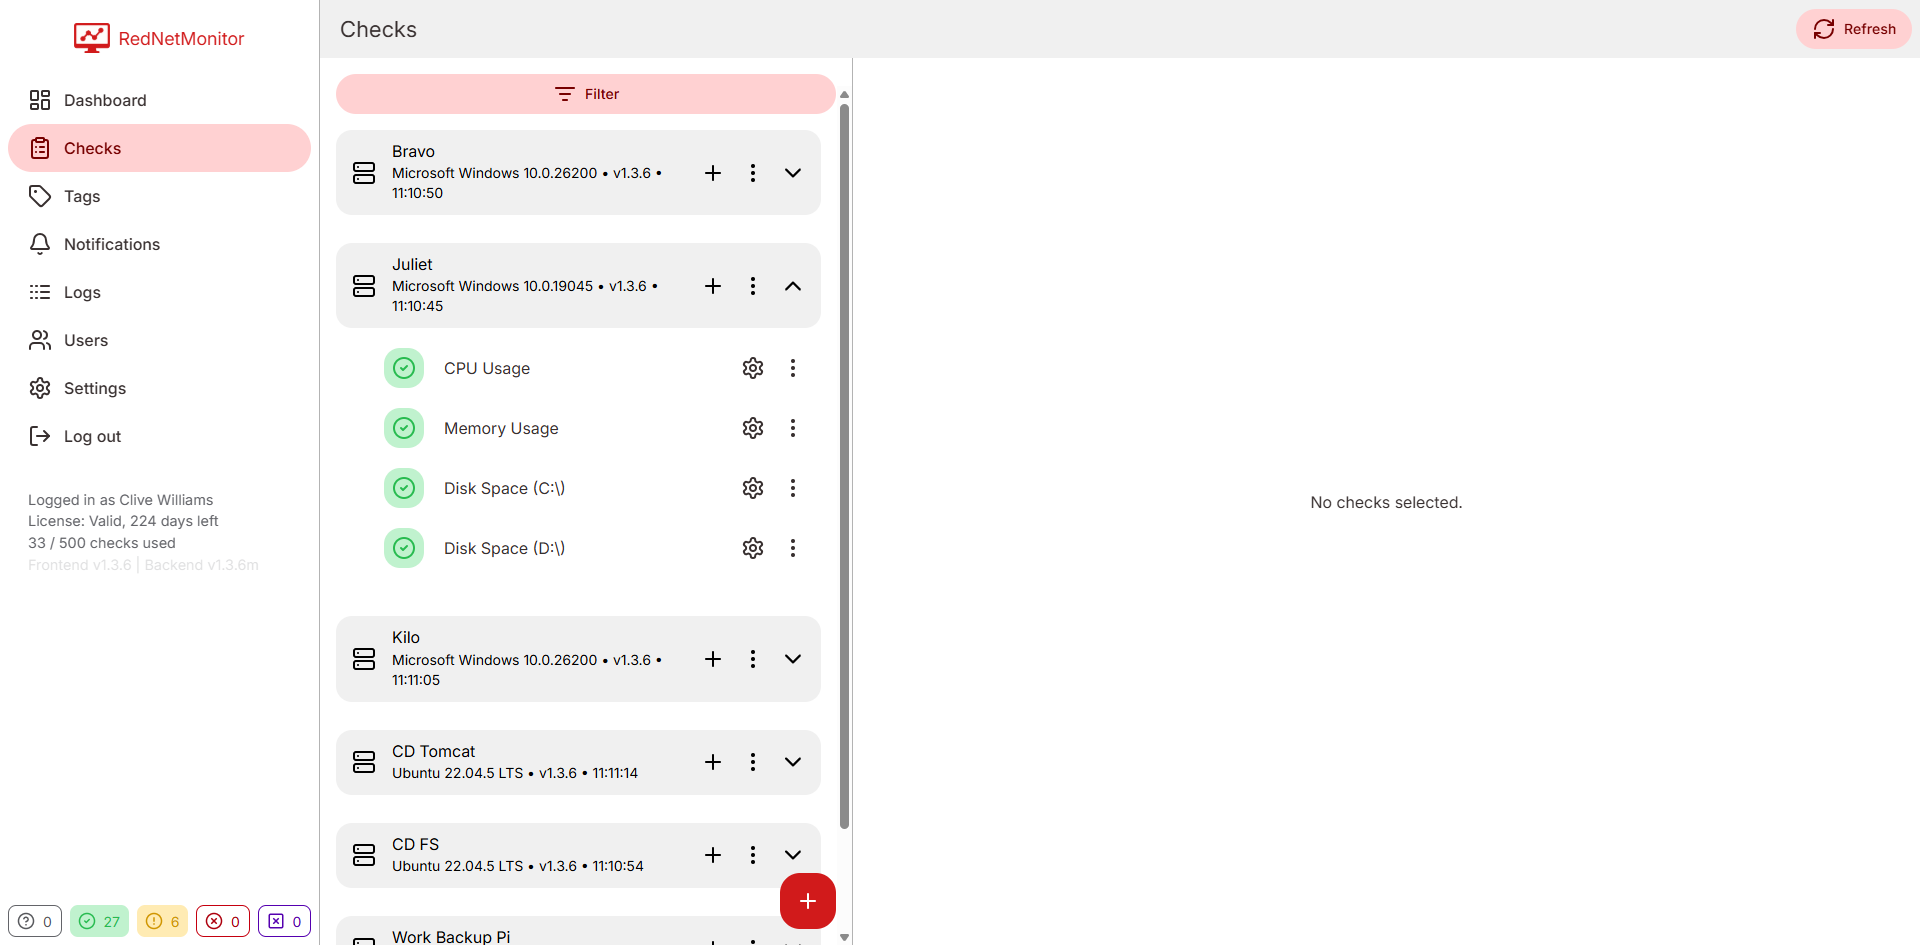
Add a check in 30 seconds.
- Go to Checks in the sidebar.
- Pick your Remote on the left.
- Click + Add Check, choose a type (start with CPU).
- Name it, set an interval (default 5 minutes), save.
- Watch the status chip on the dashboard.
Default rules ship sensible thresholds. You can tweak them on the Rules tab.
Get notified when something breaks.
Configure once. Verified with built-in test buttons.
Open Settings
Sidebar → Settings. You'll see cards for SMTP, Slack and License.
Configure SMTP or Slack
Fill in the form, hit Send test. Don't move on until the test arrives.
Tune mutes
Use Notifications to silence specific checks, Remotes or tags for yourself.
Patterns we've seen work well.
Tag by environment
Create tags like PROD, STAGING, INTERNAL. Mute Staging during deploys.
Use temporal conditions
"Breach 3 times in the last 5 checks" beats single-spike alerts every time.
Custom HTTP channels
Extract queue length from a status endpoint. Alert when it crosses your SLA.
Still stuck?
Drop us a line - most replies arrive within a business day.