System and network monitoring for Windows & Linux - self-hosted or cloud, up and running in minutes.
14-day free trial - no credit card

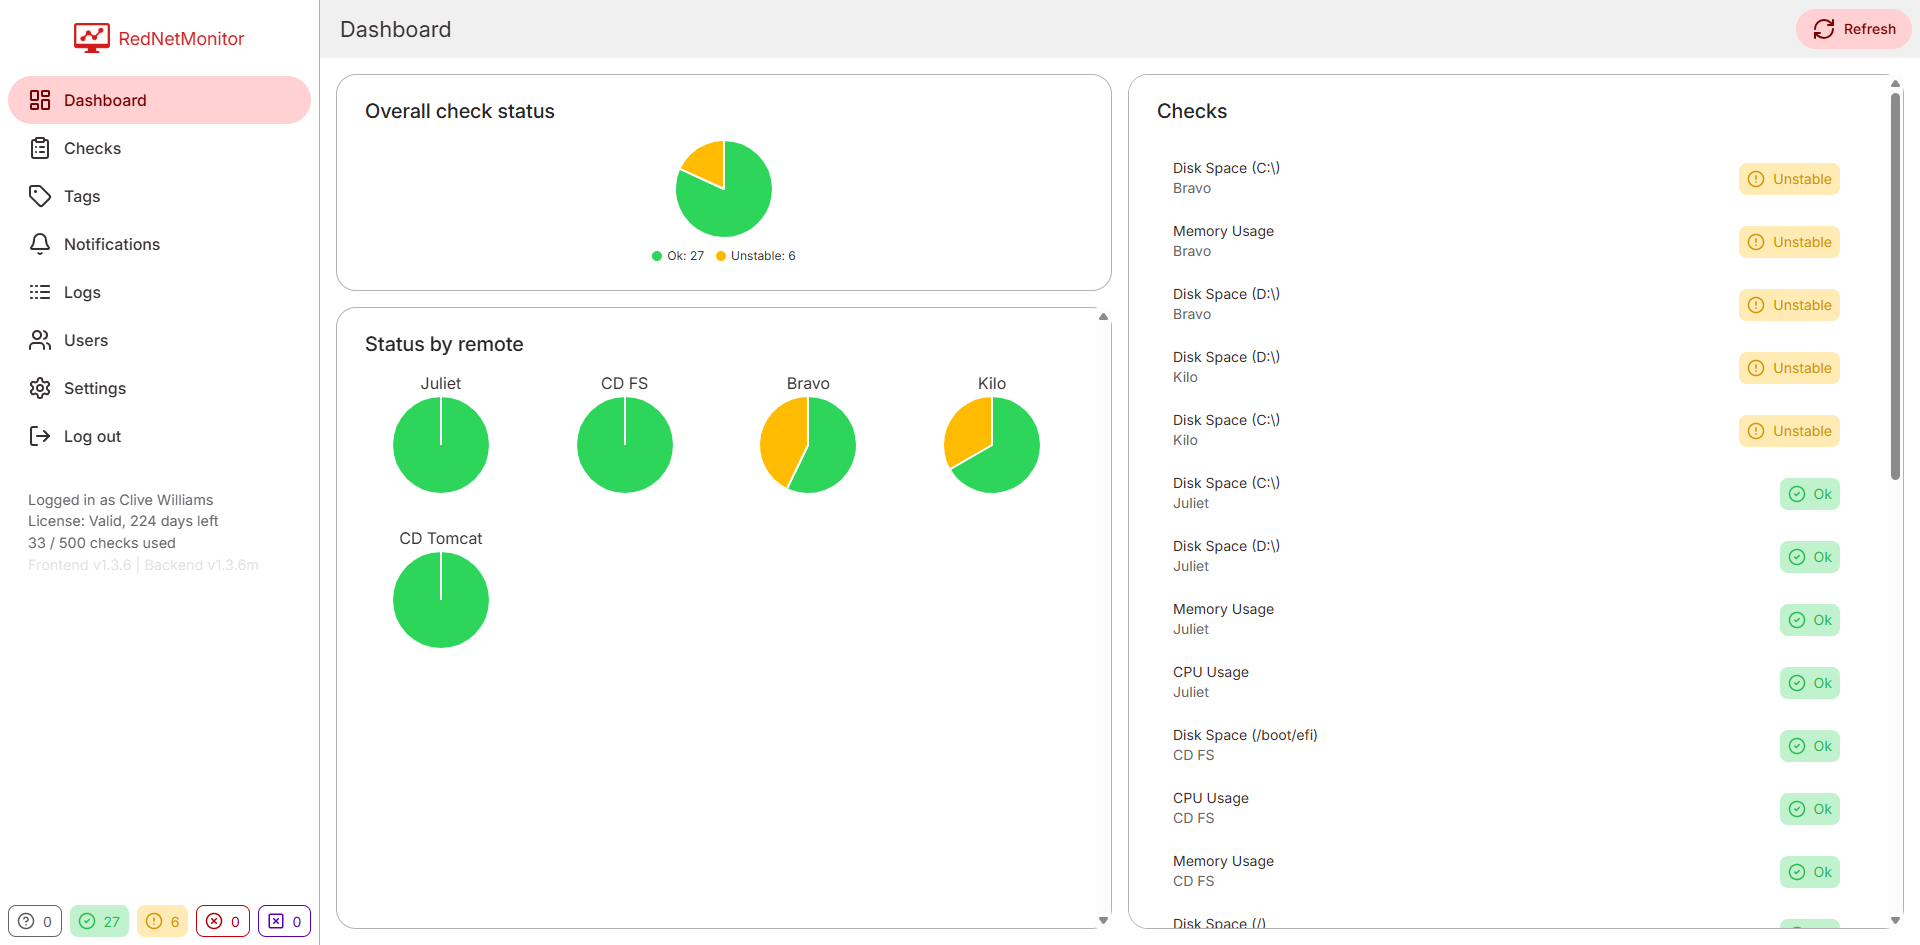
Know the moment something breaks.

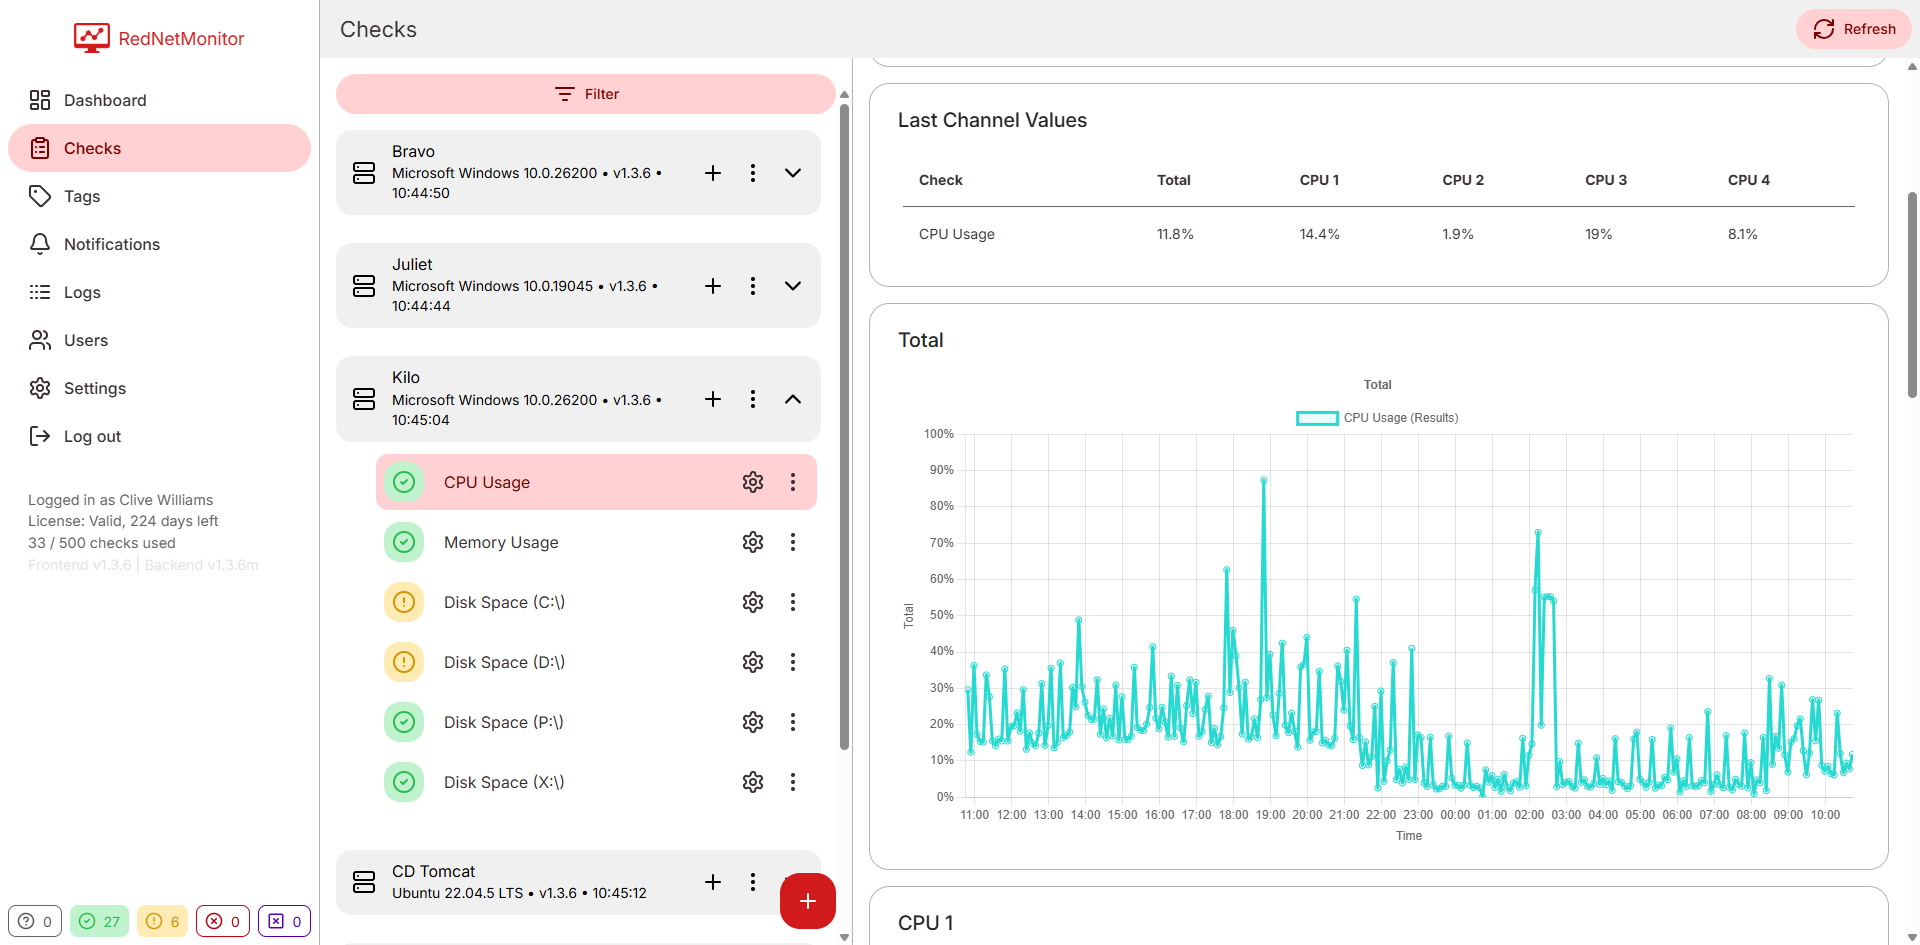
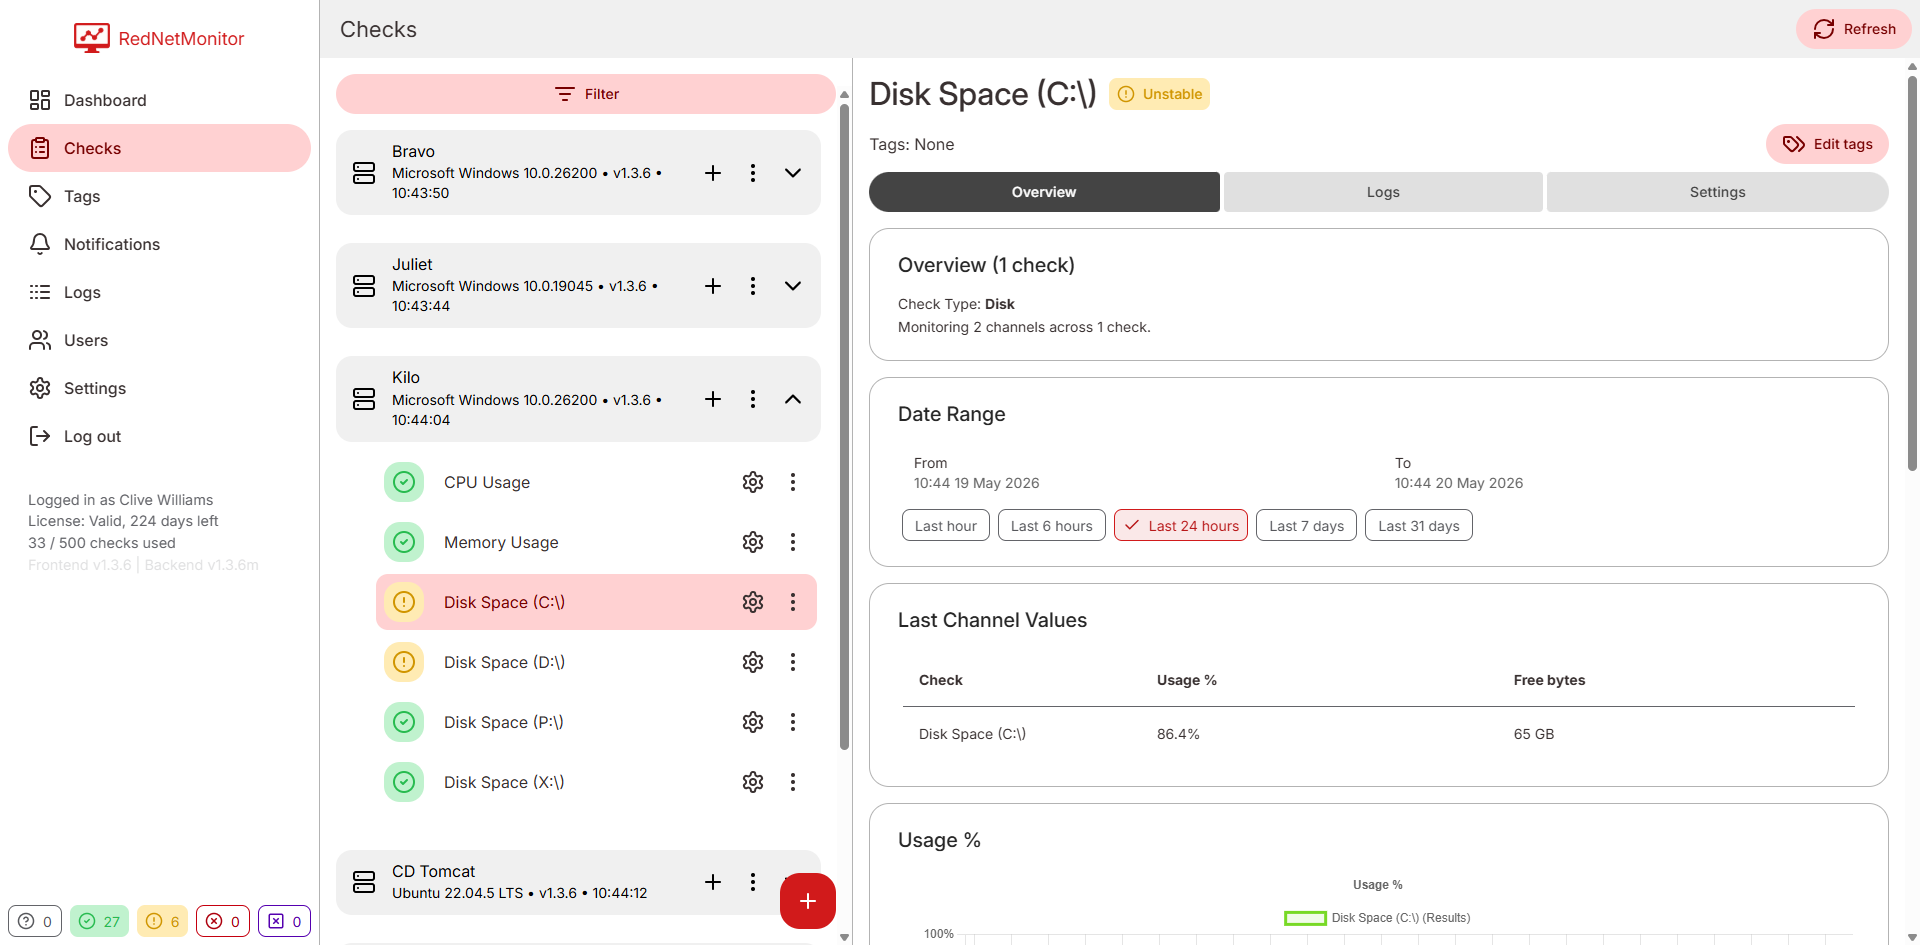
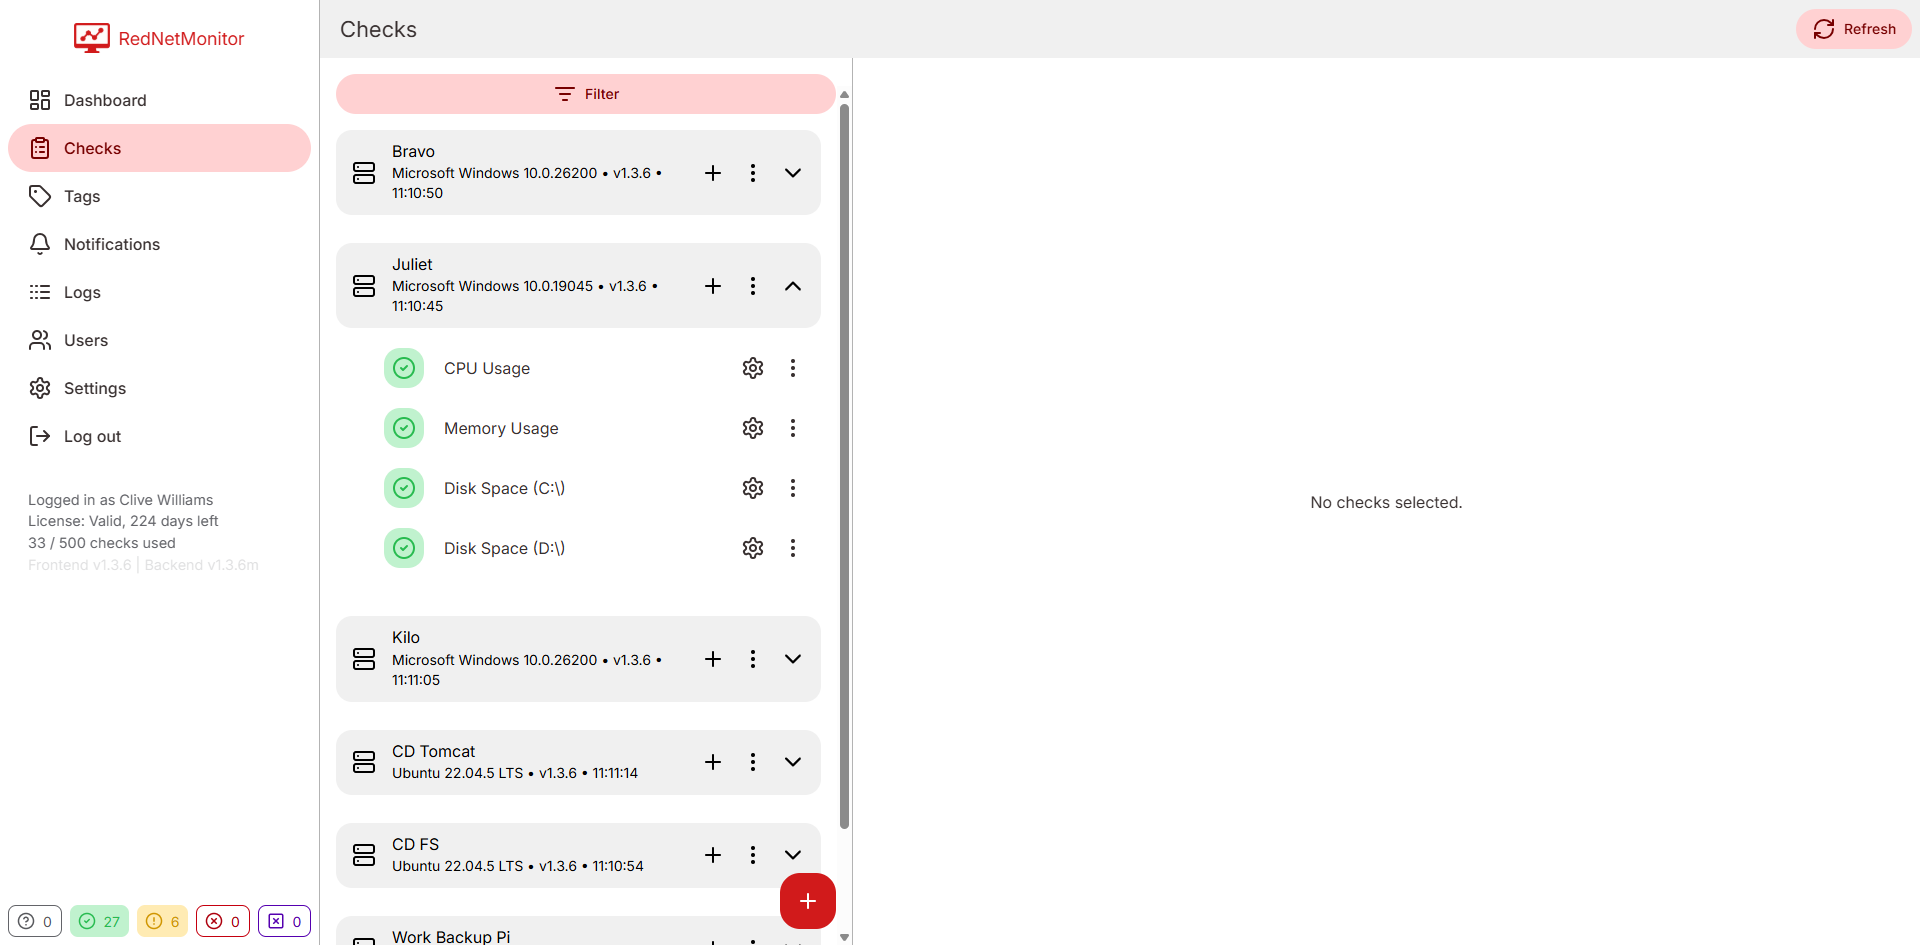
RedNetMonitor watches your servers, services and endpoints from one calm dashboard. Install a Remote, configure your checks, get alerts on email or Slack - that's the whole product.

Free self-hosted tier (up to 50 checks) Windows & Linux Cancel any time
RedNetMonitor live dashboard showing overall check status and per-remote pie charts.
Get started

Two ways to run RedNetMonitor.

Spin up a fully hosted instance we run for you, or request a self-hosted licence to run it on your own server. Either path starts with a 14-day free trial - no credit card required.

14-day free trial · no credit card · cancel any time.

Seven check types

Everything you'd actually monitor - built in.

No custom scripts to maintain. Pick a type, point it at a target, set your thresholds.

CPU
Total & per-core usage
Memory
RAM usage & free bytes
Disk
Per-mount free space
HTTP / HTTPS
Status, latency, body parsing
Process
Match by regex, count instances
Folder
File count & total size
File
Exists / missing
Custom channels
Extract JSONPath / XPath / regex
Features

The basics, sharpened.

Not 200 features you'll never touch - eight things every monitoring platform needs to nail.

Live dashboard

Server-pushed updates. Status changes appear without a refresh.

Smart status rules

Compose conditions with thresholds and temporal windows. No false positives from one spike.

Email & Slack alerts

SMTP and incoming webhooks. Test buttons built into Settings.

Per-user mutes

Silence a check, Remote or tag for yourself - without affecting the team.

Coloured tags

Organise hundreds of checks. Filter the dashboard with one click.

Roles & users

SuperAdmin, Admin, read-only. Initial SuperAdmin created during setup.

Logs & audit

Heartbeats, execution errors, SMTP failures - filterable by category and severity.

Self-host or cloud

Same UI either way. Switch later without losing a thing.

Inside the app

One dashboard, every signal.

Real screenshots - no marketing illustrations.

Main dashboard with overall pie chart and per-remote status.

Live dashboard

Overall status pie, per-Remote breakdowns, and a filterable list of every check.

CPU check detail panel with channels and status rules.

Check explanation

Every status rule shown side-by-side with its current evaluation.

Disk check showing usage chart.

Channel history

Last hour, six hours, or 24 hours - without leaving the check.

Remotes and checks two-pane view.

Remotes & checks

Two-pane layout. Pick a Remote on the left, edit its checks on the right.

Coloured tags management.

Tags

Group related checks. Use them for filtering or bulk muting.

Status, exactly five ways

No ambiguity. No alert fatigue.

Every check resolves to one of five statuses. Tune the thresholds yourself - or accept the sensible defaults.

Ok Unstable Critical Fail Unknown
# Example rule sentence - exactly what the rule editor produces. Total > 80 at least 3 times in the last 5 measurements → Critical Total > 50 at least 3 times in the last 5 measurements → Unstable otherwise → Ok

Start monitoring in under 10 minutes.

Sign up, install a Remote, see your first check turn green.